The ‘Reports’ section on the Pitch N Hire dashboard provides in-depth insights into your recruitment activities, helping you track and analyze various aspects of your pipeline and team performance.
Located next to the ‘Overview’ tab at the top of the dashboard, this section is divided into four distinct report categories: Jobs, Job Applications, Candidates, and Team. Each category provides detailed data and visualizations relevant to its focus area.

When you click on the ‘Reports’ tab, you will be taken to a page where you can access these four categories. To switch between different reports, simply click on the category you wish to view.
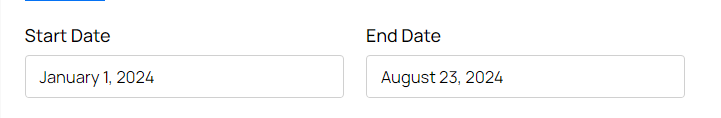
Upon opening each category, you will find ‘Start Date’ and ‘End Date’ filters. These filters allow you to define the specific time range for which you want to generate reports. By selecting appropriate start and end dates, you can customize the data range for your reports to fit your needs.
Jobs
For the ‘Jobs’ category, you will see exact counts for different job statuses within the selected date range:
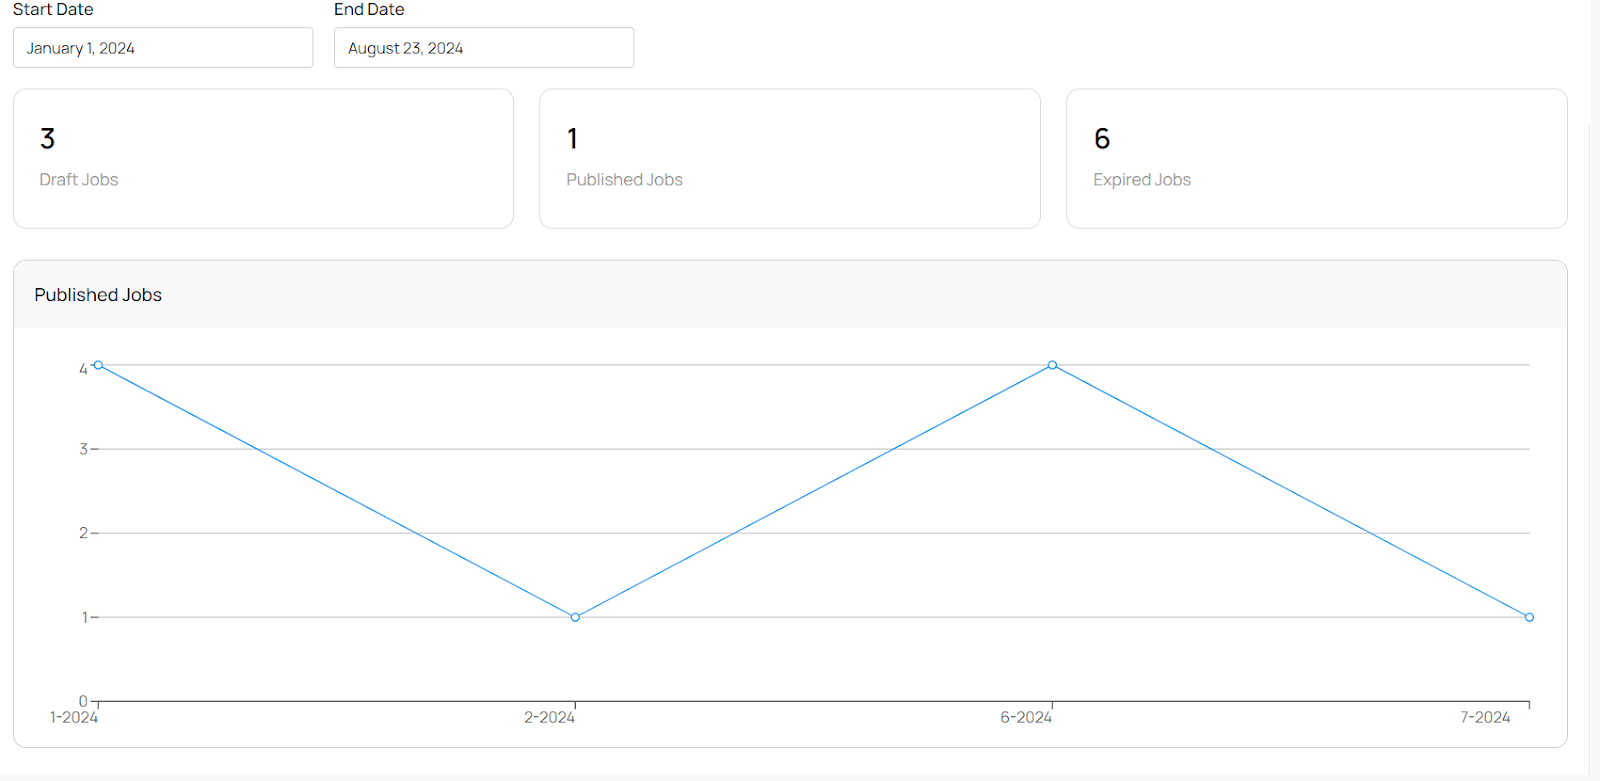
- Draft Jobs: Displays the number of job postings that are in draft form and have not yet been published.
- Published Jobs: Shows the count of jobs that are currently live and visible to candidates.
- Expired Jobs: Indicates the number of job postings that have expired and are no longer active.
Below the job counts, a graph provides a visual representation of job performance over the selected period. This graph illustrates trends and changes in job postings, helping you assess how your job listings have performed in terms of visibility and engagement.
Job Applications
In the ‘Job Applications’ category, you will find detailed counts for different types of applications:
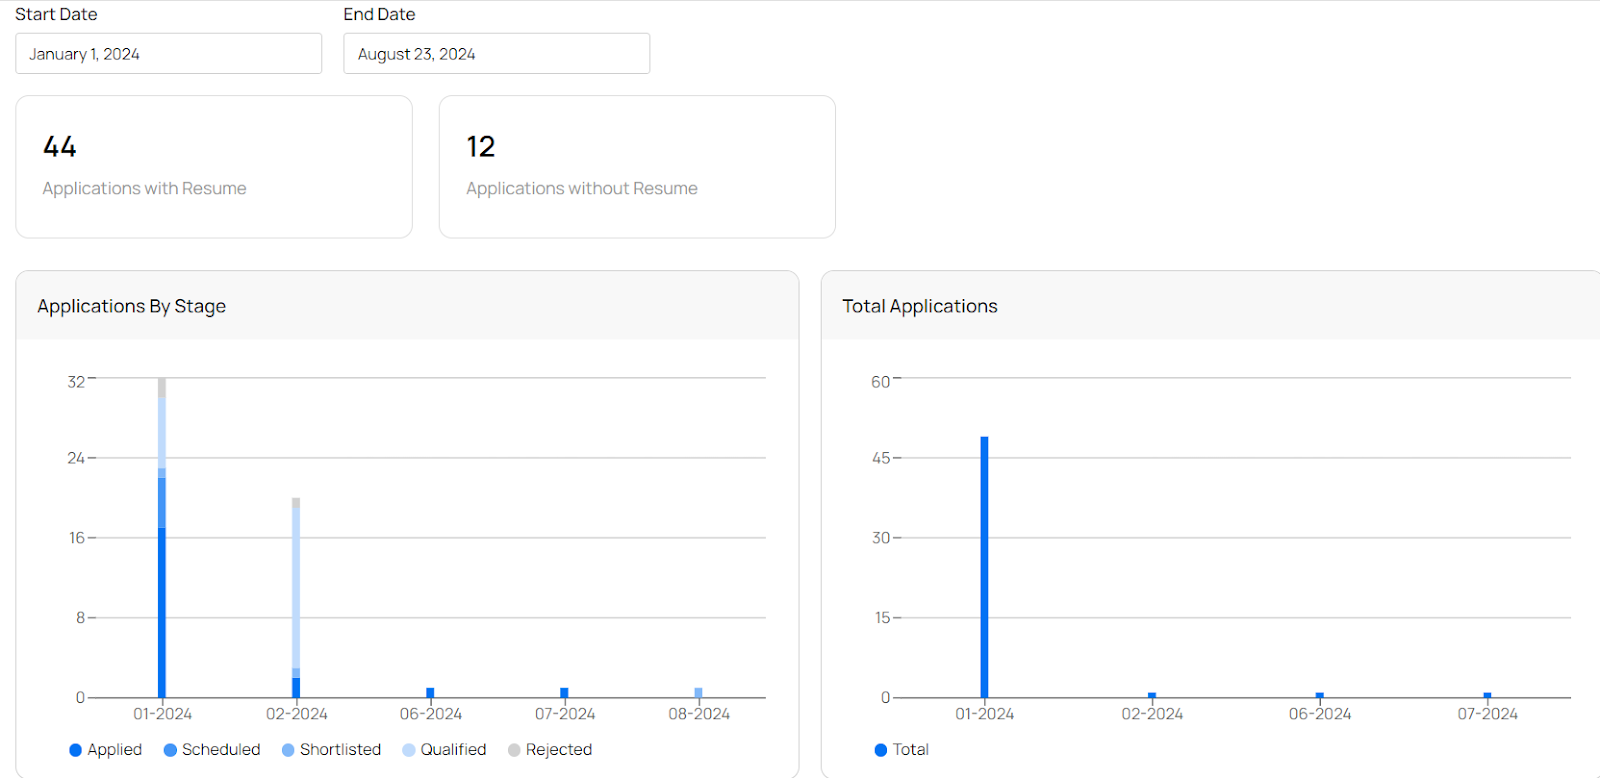
- Applications with Resume: Shows the number of applications that include a resume.
- Applications without Resume: Indicates the number of applications that are missing a resume.
Beneath the counts, a graph displays the performance of these applications over the selected time range- one by stage and another by the sum total of all applications. This visual aid helps you understand trends in application submissions and identify any patterns related to resume submissions.
Candidates
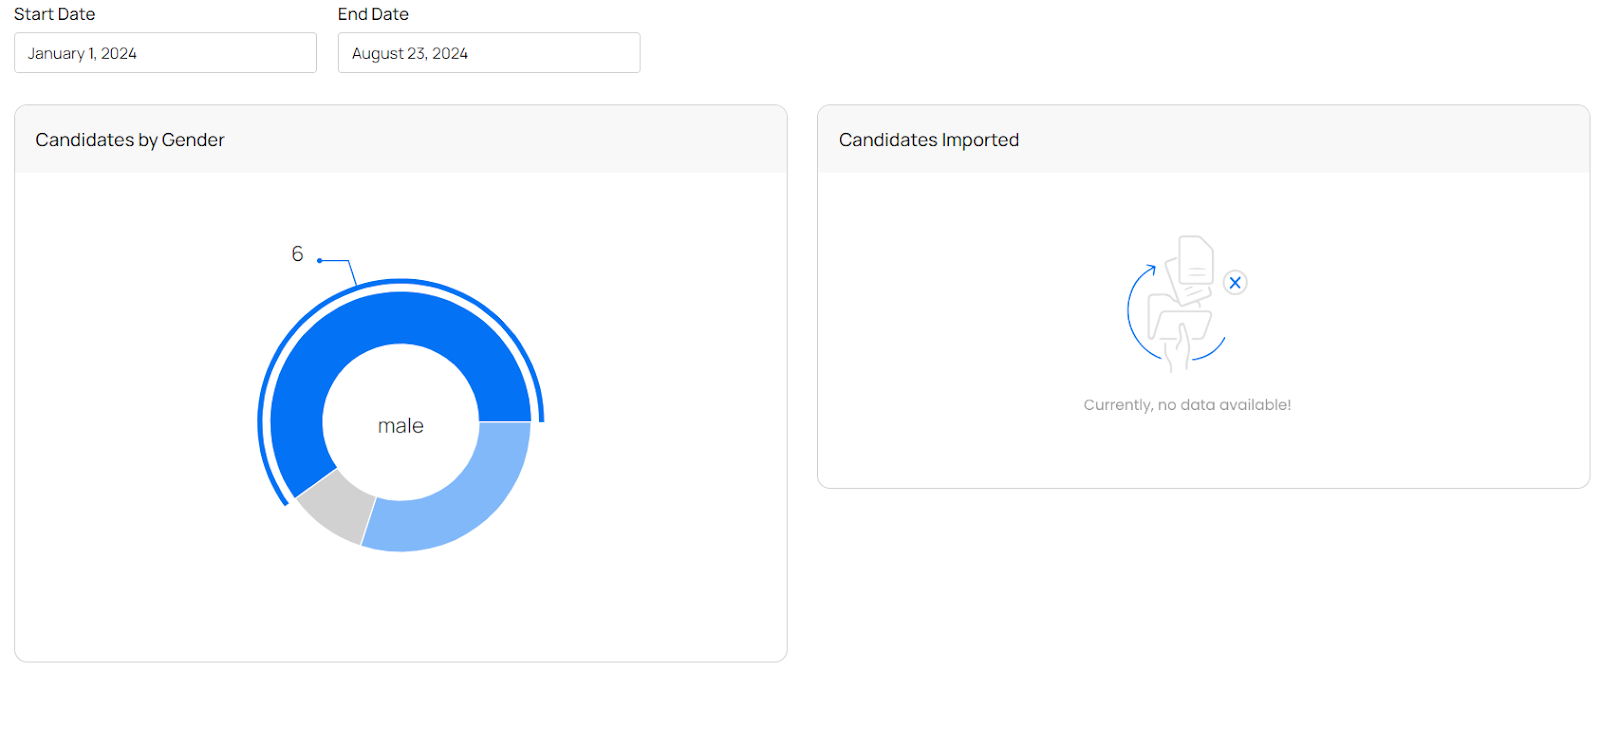
- Candidates by Gender: This chart provides insights into the gender distribution of candidates, supporting bias-free diversity hiring trend studies. It helps you analyze the demographic composition of your candidate pool and assess your recruitment efforts from a diversity perspective.
- Candidates Imported: This chart shows the number of candidates imported from major job sites other than Pitch N Hire. It helps you track the effectiveness of your external sourcing efforts and understand how many candidates are being brought into your system from various external sources.
Team
In the ‘Team’ category, you will find detailed metrics on your team's productivity within the selected date range:
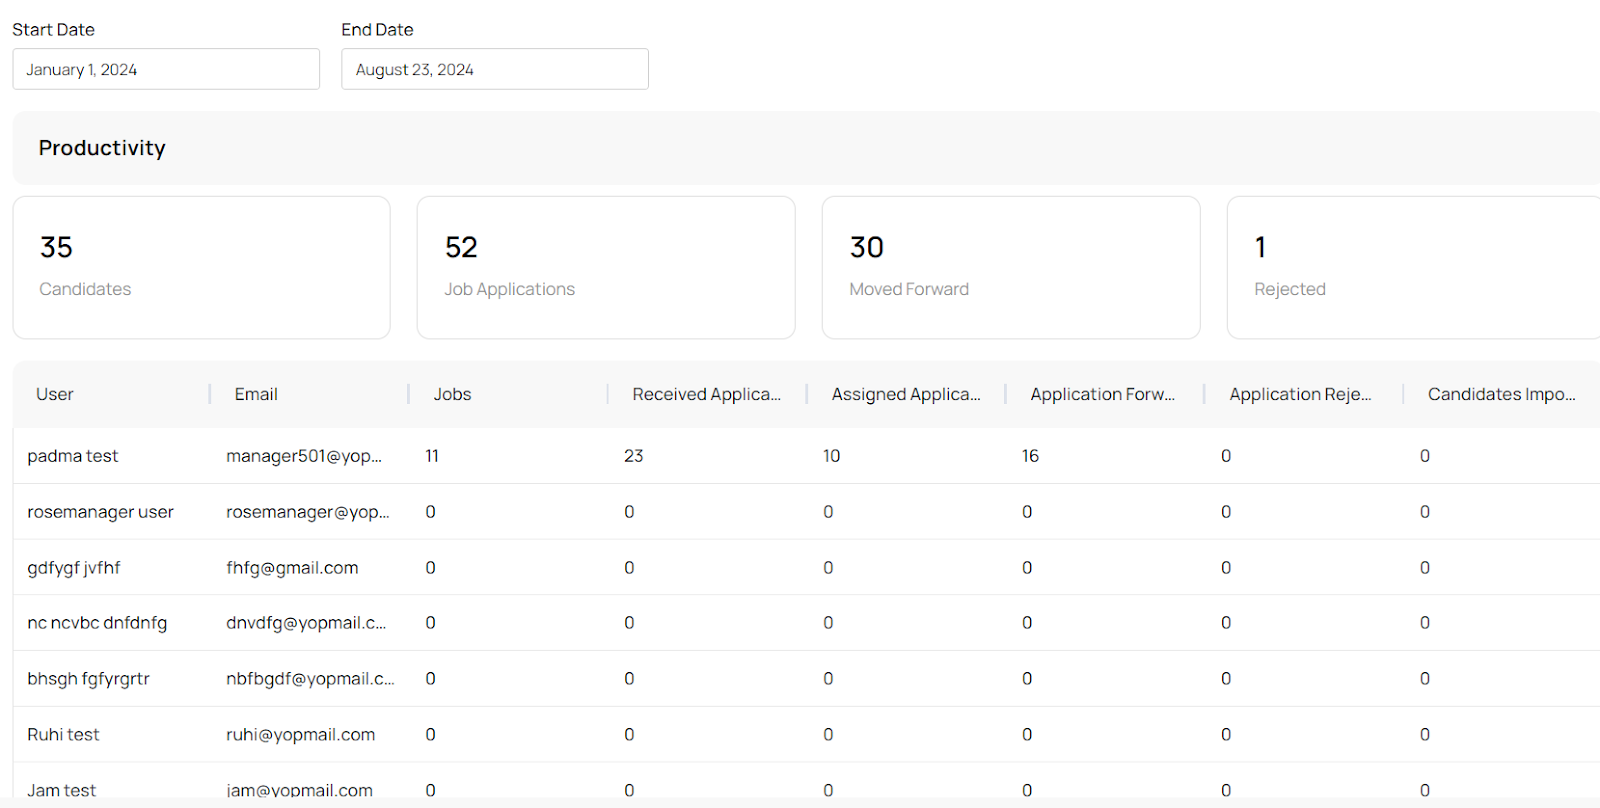
- Candidates: Displays the number of candidates managed or processed by your team.
- Job Applications: Shows the total number of job applications handled by your team.
- Moved Forward: Indicates the number of candidates who have progressed in the recruitment process.
- Rejected: Shows the number of candidates who have been rejected.
Below the productivity metrics, a comprehensive table provides detailed information about each team member's performance. The table includes the following columns:
- User: Lists the names of team members.
- Email: Displays the email addresses of team members.
- Jobs: Shows the number of jobs for which each team member is the hiring manager.
- Received Applications: Indicates the number of applications received by each team member.
- Assigned Applications: Shows the number of applications assigned to each team member.
- Applications Forwarded: Displays the number of applications forwarded to other stages or team members.
- Applications Rejected: Indicates the number of applications rejected by each team member.
- Candidates Imported: Shows the number of candidates imported by each team member from external sources.
Leveraging the detailed reports and graphs in the ‘Reports’ section can help you gain valuable insights into your recruitment activities, track performance, and make data-driven decisions to optimize your recruitment process.